


Welcome back to The Alternative Desk, where we’re going to once again delve into a new genre of post: First Principles.
The purpose of these posts is to deep-dive into a quantitative topic, from the generally rather dry theory to the more interesting question of how it can be exploited to create profitable strategies. It should also function as a helpful primer to much of the theory behind what we’re going to cover in the more strategy-driven ‘Research Desk’ posts, keeping them free of definitions and focused on the more interesting bits.
Those who’ve followed the desk for the past month will know that our universe for the quarter is betting markets. Specifically betting exchanges, which was picked for the astute reason that they were the only venues which I could both access and hadn’t been stake-restricted on.
The fundamental driver of winning strategies in all betting, including across betting exchanges, can be boiled down to one concept: Expected Value (EV). It’s both easy to define and difficult to confirm the existence of. Not quite God, but for our purposes it may as well be. So today we’re going to explore EV for betting markets, from theory, to practice, to statistically significant amounts of practice to minimise variance.
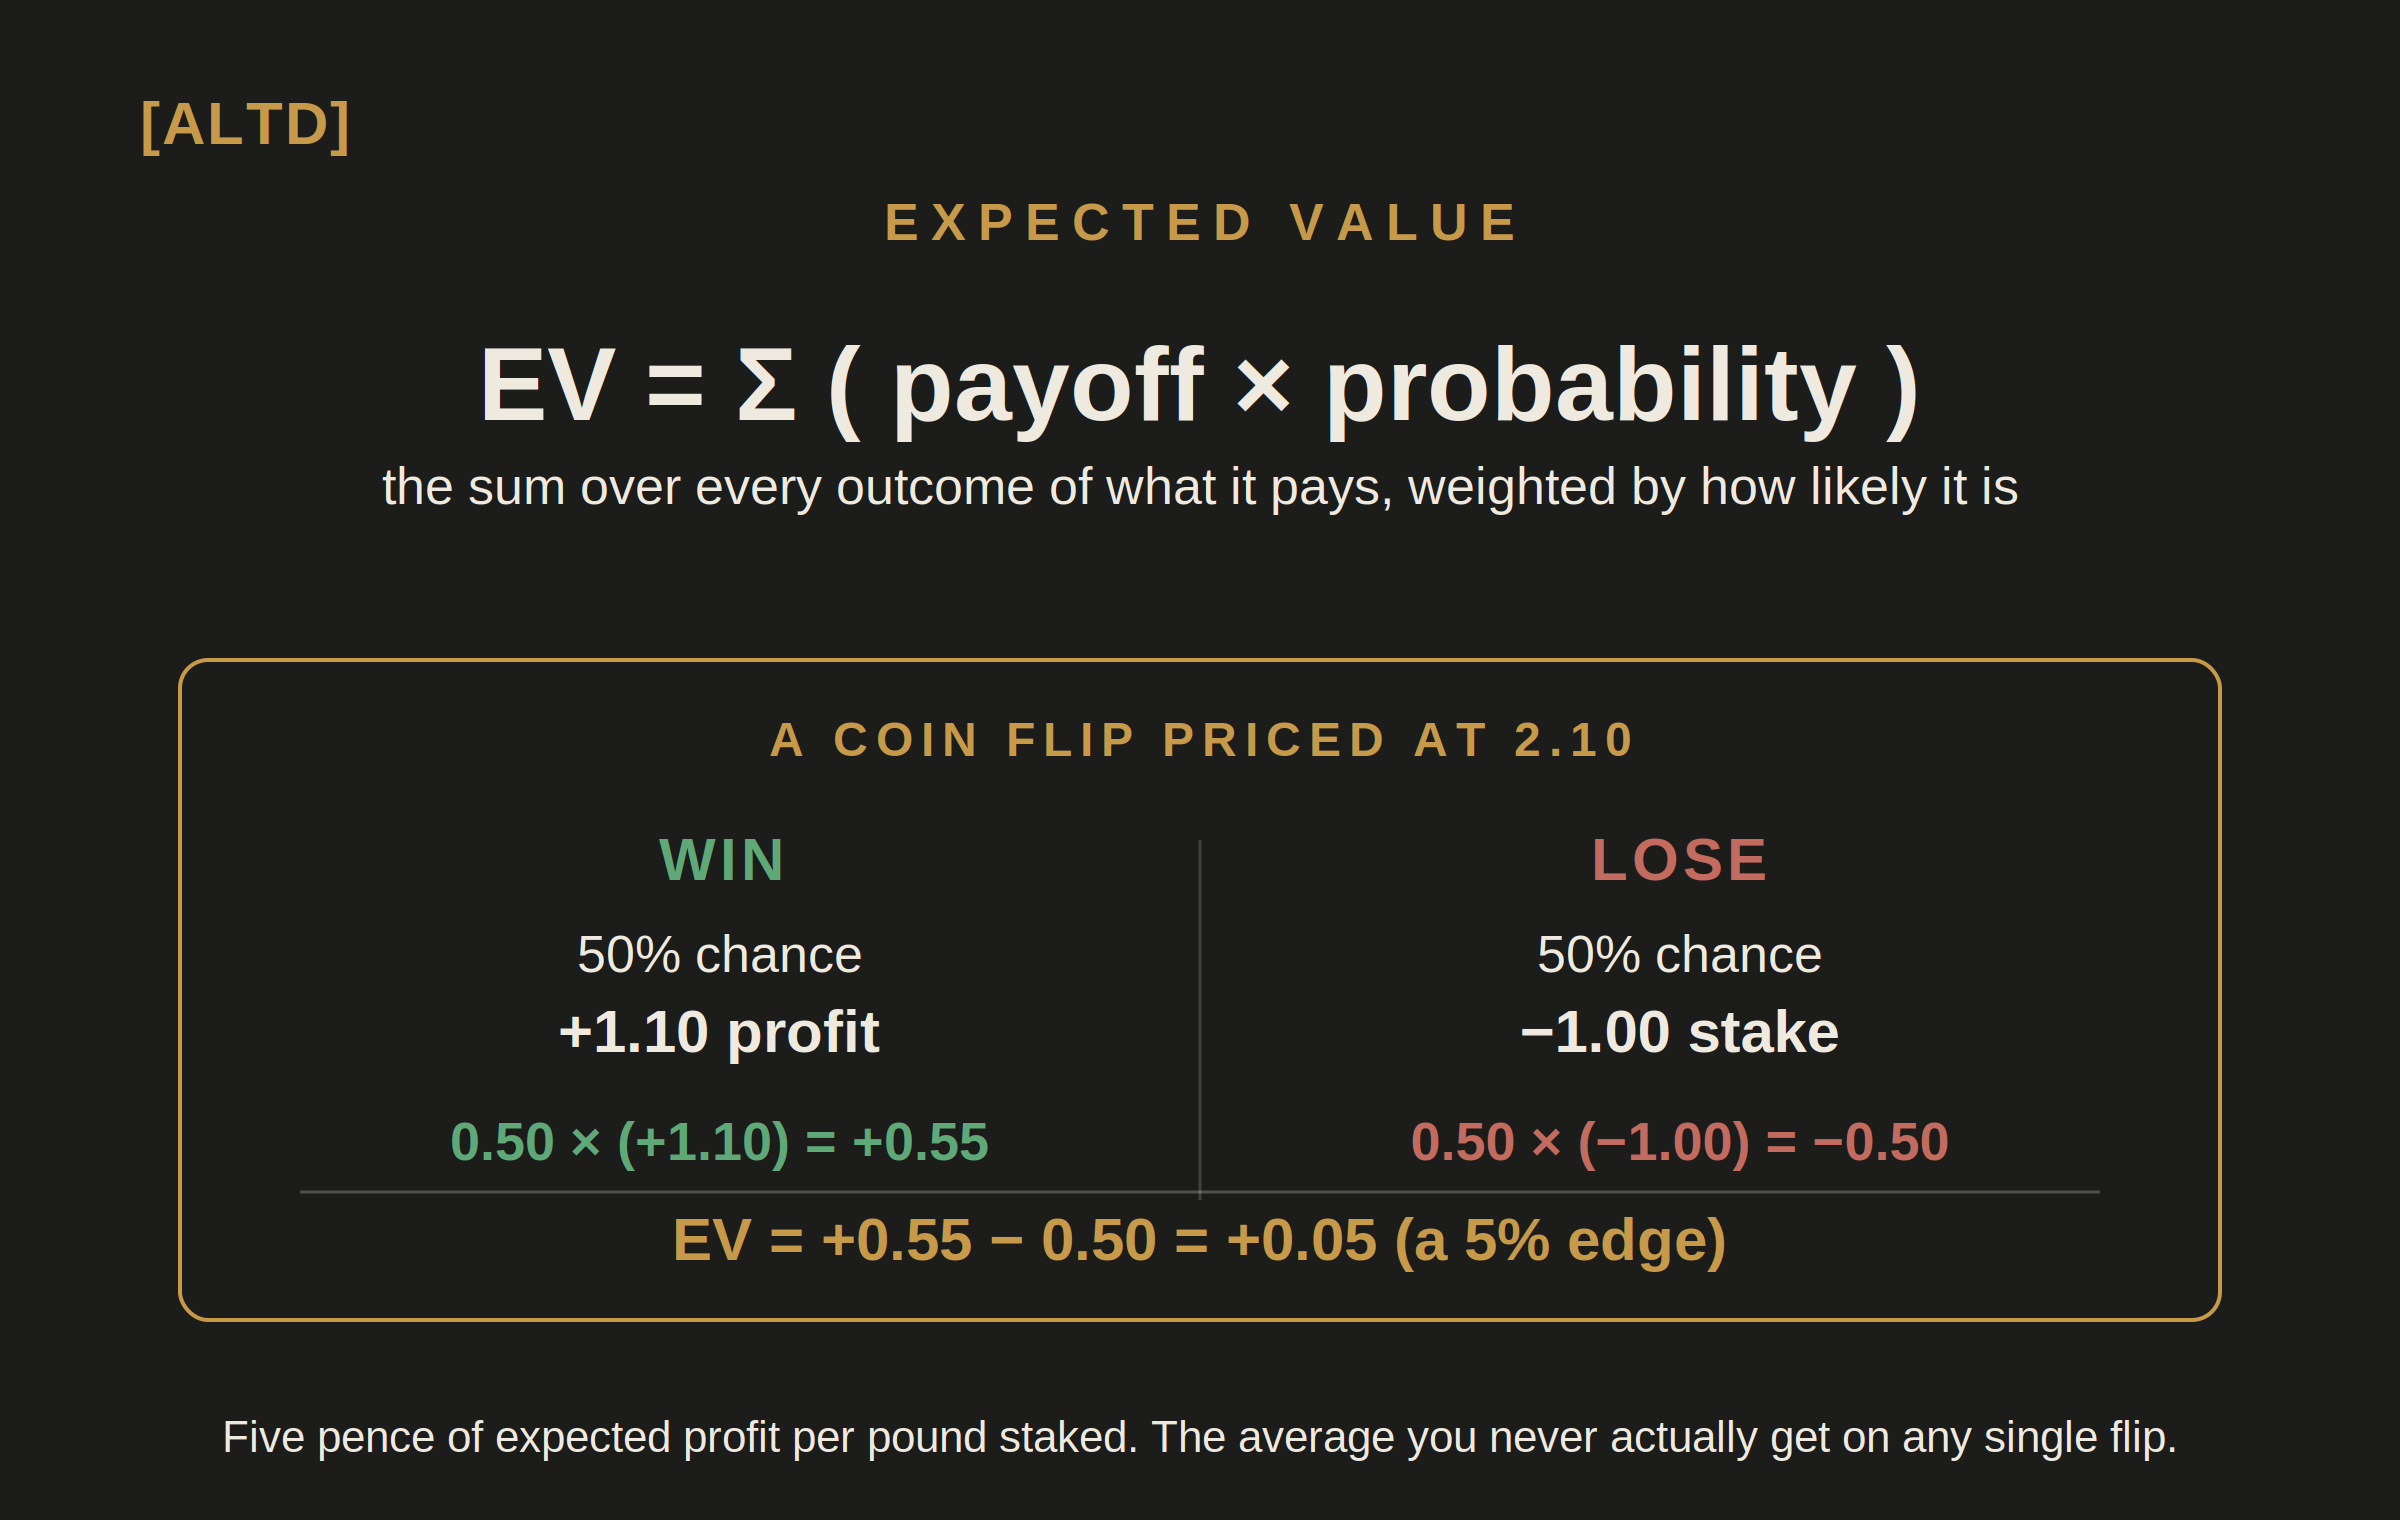
So a sportsbook has cost-cut a little bit too aggressively in its odds team, and now has a line on its website at 2.1 for a fair coin-flip. Using our formula to sum the products of the different payoffs and probabilities, we can see we’ve found a tidy little 5% edge. Unfortunately, we’re going to spend the rest of this post discovering that a 5% edge is difficult to both identify and use, but at least that gives me some content to write about while I try to do something actually interesting for the next editions of The Research Desk.
But, whilst this was a nice example in isolation, what with its known true probabilities and all, how about something we’ll actually see on a sportsbook, and how does this relate to EV? Well as we know every price implies a probability of the event occurring (the decimal odds’ reciprocal, which is yet another reason to move from the ghastly American odds format). In absolute isolation we might not know whether this is a fair price. But if we add up the implied probability across all the lines, representing all the outcomes of a market, we can get a mathematical idea of just what the margin is on a sportsbook’s market.

Here we can sum the reciprocals and we get 105.3%. That excess above 100% is known as the ‘vig’. Sometimes also referred to as the overround, juice, or if you’re feeling a touch archaic, ‘vigorish’. This is essentially the average margin the bookmaker will make on a bet, and the lower the vig, the more competitive odds you’re seeing.
As we previously mentioned, the true price of an event is ‘discovered’ on sharp books which charge a very low vig, taking money from high-value bettors and syndicates, with the lines being adjusted based on this action until the market reaches an approximate consensus. From there, the number travels. Data companies buy the sharp lines, package them into a feed, and sell them on. The household sportsbooks sponsoring the shirts are, for the most part, displaying a bought-in price rather than one they worked out themselves, then marking it up with their own margin on top. So the price a casual punter sees has already passed through several hands, discovered by people who bet for a living, wholesaled by a middleman, and vigorously vigorished by a brand whose entire model depends on that markup.
But of course, we don’t care about soft books, although knowing the mechanics may give you a few ideas of how to find +EV bets on them (see: Steam Chasing). What we care about is finding the true price of an event, and we’ve just stumbled on how to do this. Strip the thin vig out of a sharp line to recover the true probability, and you have a benchmark. A bet is positive expected value if, and only if, you can get odds better than that devigged sharp price. There are multiple ways to devig these lines, but on relatively low vig markets it’s sufficient to just divide the implied probabilities by (1 + vig %) and you’ll have an accurate-enough set of probabilities to base your assumptions off.
Excellent. Maybe? We do appear to have gone round in a circle here. The sharp odds are generally the best odds, both in terms of highest odds available to the bettor and accuracy, that we can access. If we can even access them. And it’s also our benchmark for the true odds (once devigged). And the sportsbooks are for the overwhelming majority of the time taking these odds and adding an extra margin on top of them. So how are we going to actually find any winning bets?
As the old saying goes, if you want EV done properly, you have to do it yourself. It’s up to us to come up with models, or identify inefficiencies, that would mean the odds we’re being offered imply a lower percentage of winning than the true probabilities. Luckily, I have some interesting posts coming up on that. But the hard part is the input. Let’s imagine we’ve endeavoured to create a football model, that predicts the true probabilities of teams to win a match. You’ve bought a nice new bag of locally roasted coffee, and had an afternoon in with the seminal paper on football modelling by Dixon & Coles. And now your model’s up and running and firing out predictions hither and thither.
Most excitingly of all, it keeps telling you that there are some very nice looking bets knocking around. In particular, tonight, your model thinks there’s a 50% chance Rayo Vallecano will beat Barcelona (at this point you may want to check your model hasn’t mixed the team names up), which would correspond to fair odds of 2.0. You smile to yourself at how simple the reciprocals are to calculate and thank the universe that you don’t use American odds. But lo and behold, on your betting venue of choice, you see Rayo Vallecano priced at 2.1. Repeating our coin-flip maths from earlier, we know we have a 5% edge.
Don’t we? Well according to our model yes we very much do. But that model relies on its own calculations to give us a probability estimate. And being the ever cautious young padawan that you are, you have a simple question: how do I know my model’s estimate of the true probability is any good?
Closing Line Value (CLV)
Well there are a couple of ways to answer that question. Our first is CLV. We already said the devigged sharp closing line is the market's best estimate of the truth. How good is that estimate? Pretty good actually. Not perfect, but actual research is published on these things and the general consensus is that where the market settles before the event starts on sharp books is a high-quality predictor of the true probabilities of the various outcomes.
So what’s our plan? Beat this line. Prices will move around significantly between when they first become available to bet on and the close. If you’re consistently taking prices better than the CLV, you are consistently beating the most informed opinion available, and you can know it without a single result coming in. And not needing results to come in is a big pro. Aside from the admittedly major bankroll and staking considerations, we can almost ignore the actual outcomes of individual bets, safe in the knowledge that we’ll win in the long run.
But there are downsides. The ultra-efficient price-discovery type process happens on the biggest markets on the sharp books. If you were say, running a desk that wanted to focus on slightly niche strategies, possibly betting on exotic corners of the book, there is not going to be a tightly efficient CLV for you to use for comparison. Most of these sharp books do exotic lines, but the limits are smaller and it’s hard to call a price efficient when £14 moves the line.
Outcome Validation
It’s time to strap up and get statistical. The second way to confirm your probabilities are any good is to place the bets and measure what actually happens. Track your realised return and see whether it’s statistically convincing that you’re actually doing something useful. Simple in principle. Unpleasant in practice, due to the very thing we’ve been trying to avoid talking about the whole time: Variance. Enjoy your one-way ticket to statistical despair.
Consider a bettor with a real, genuine, not-imagined 5% edge. The best kind. And ask a simple question: after 100 bets, in a normal odds range, how likely are they to be sitting on a loss?
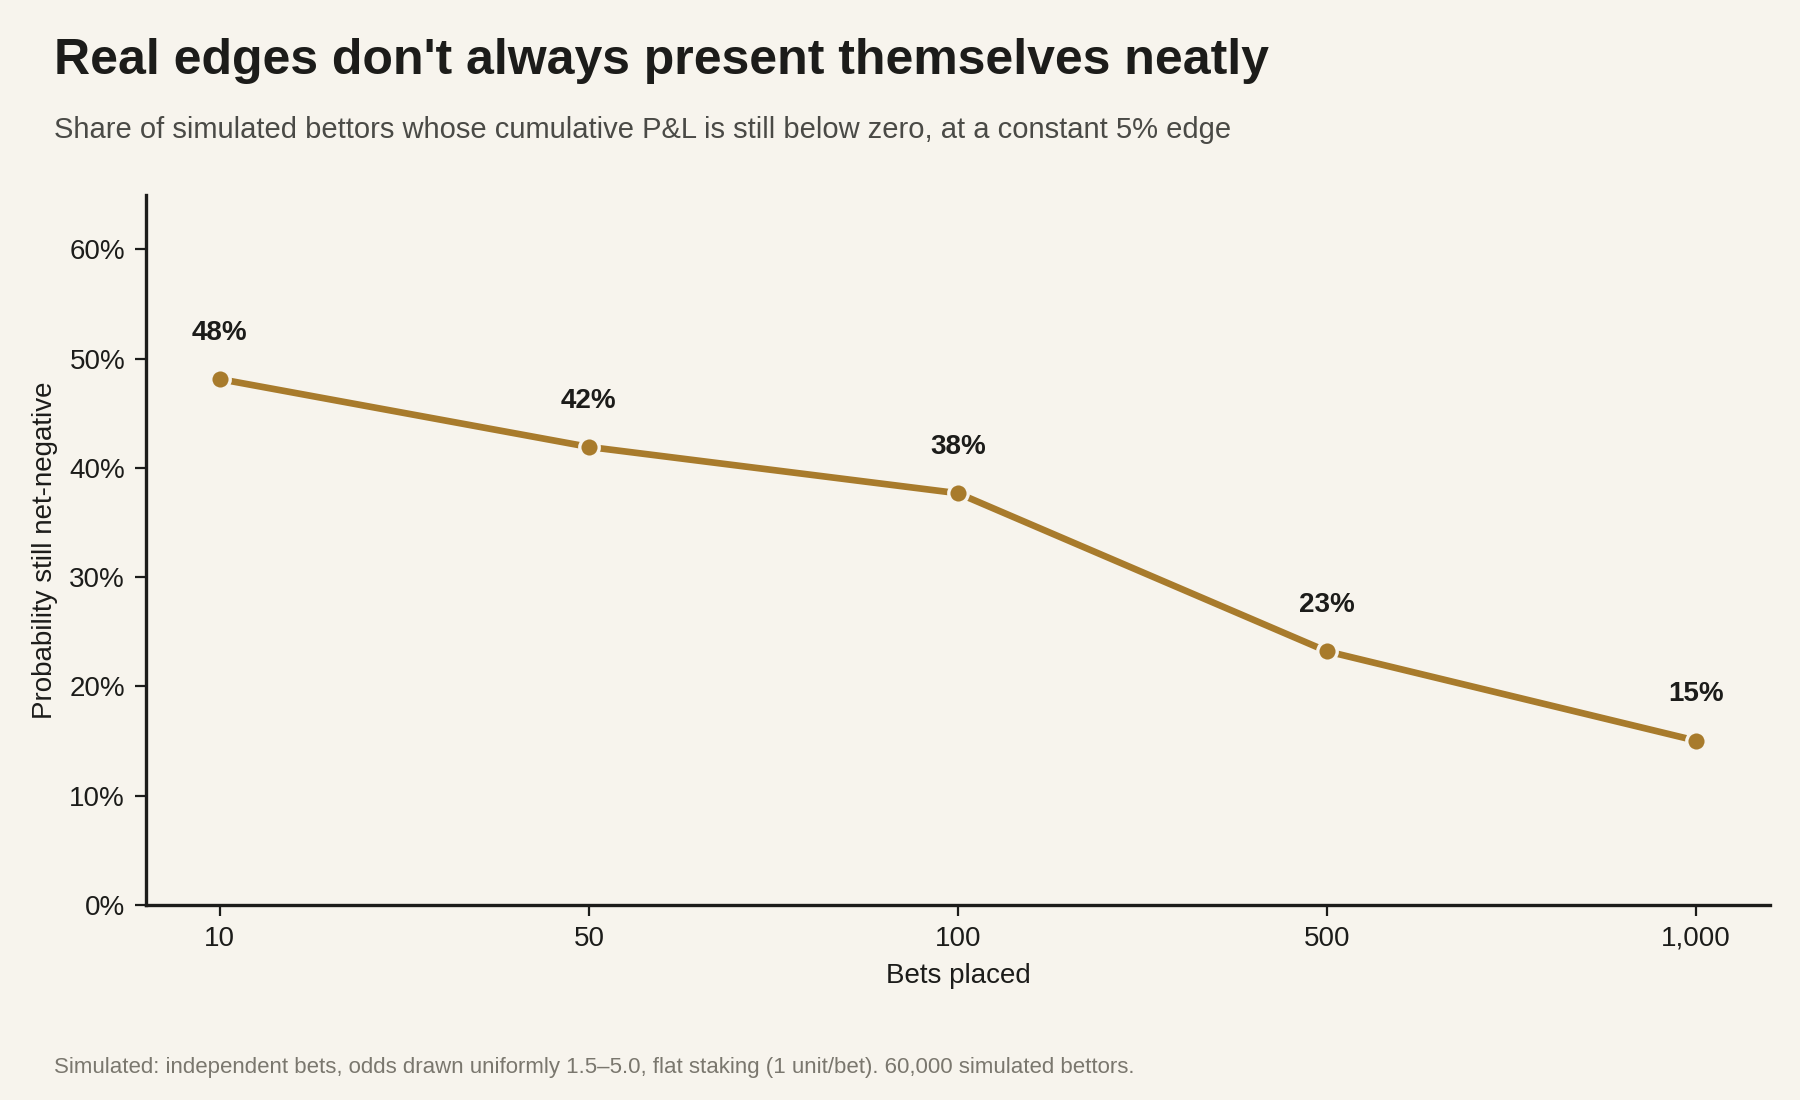
Oh dear. Nevermind 100 bets, our condolences are going to have to go the poor Joes who are 1000 bets in and still net-negative. All 15% of them. Of course seeing the individual paths at least provides some intuition for the level of variance a particular bettor can expect over 1,000 bets.
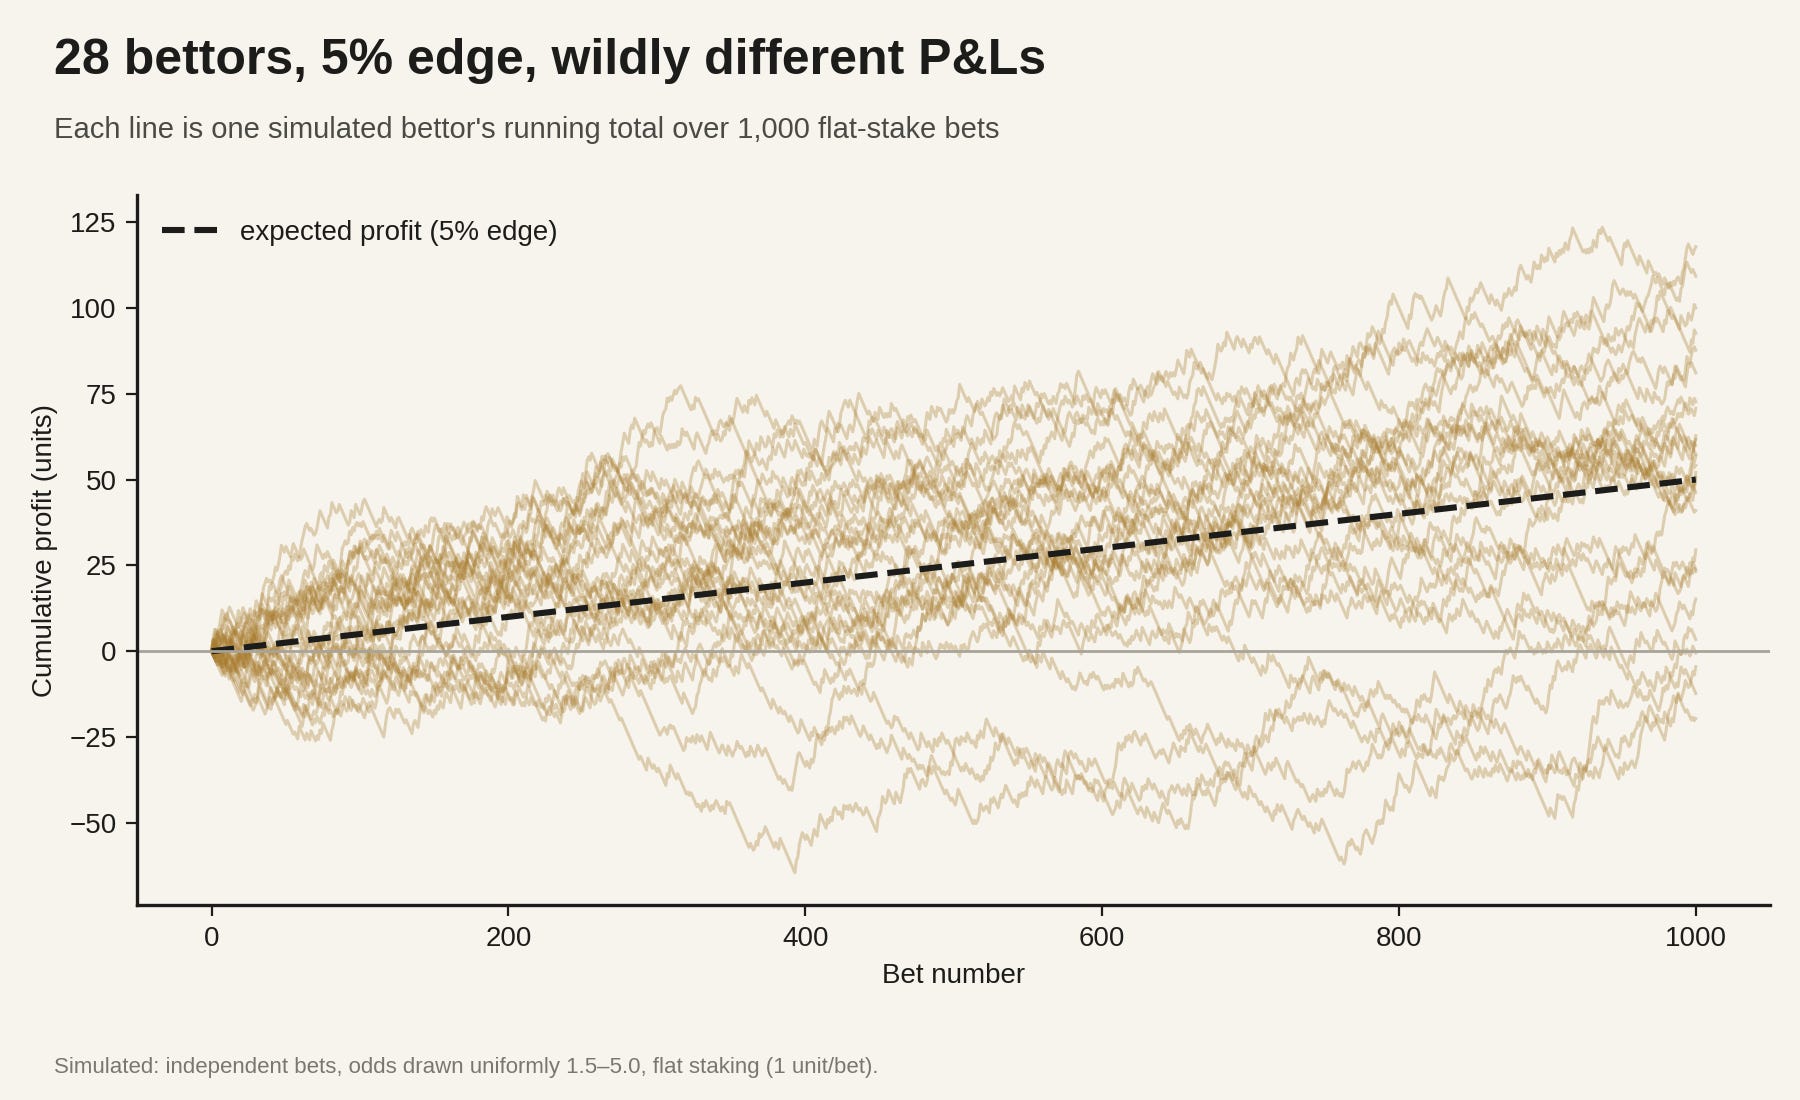
So if we’re taking my fairly strong hint from a few paragraphs ago that the CLV isn’t always going to be available or useful to us for some of the strategies we’re going to explore this quarter, then what the hell are we going to do with this? If we want to prove our edges exist with statistics, so far the only reliable way to do this is to bet more. At last, a methodology the degenerates and statisticians can both support.
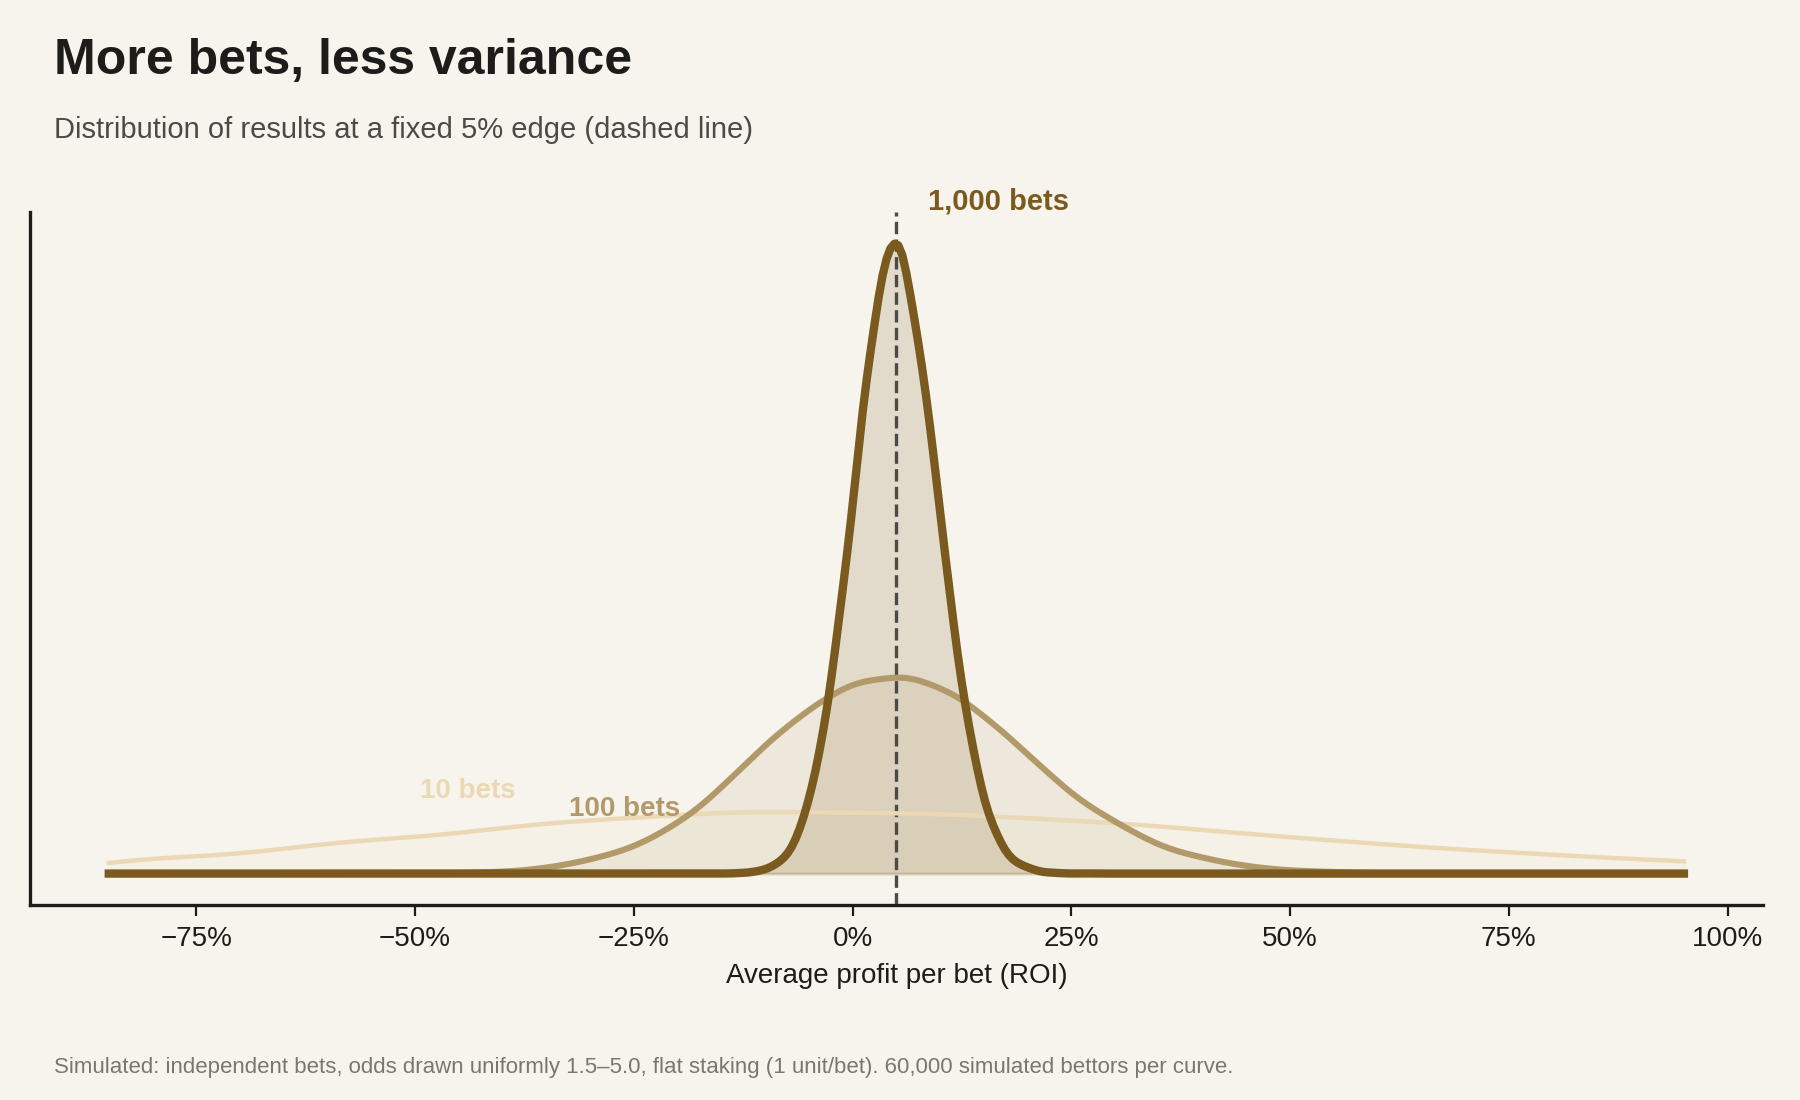
In fairness, it does at least seem to work effectively. Mathematically speaking, as the number of bets n grows, your expected profit grows in proportion to n, while the noise around it grows only with √n. That means, over enough bets, the signal from a genuine edge grows faster than the noise created by variance. But have we factored in the parameters of these simulations into this? As those who bother to read graph legends can see, we have assumptions around edge %, odds and staking. By tweaking these, can we make our lives easier in terms of validating our strategy?
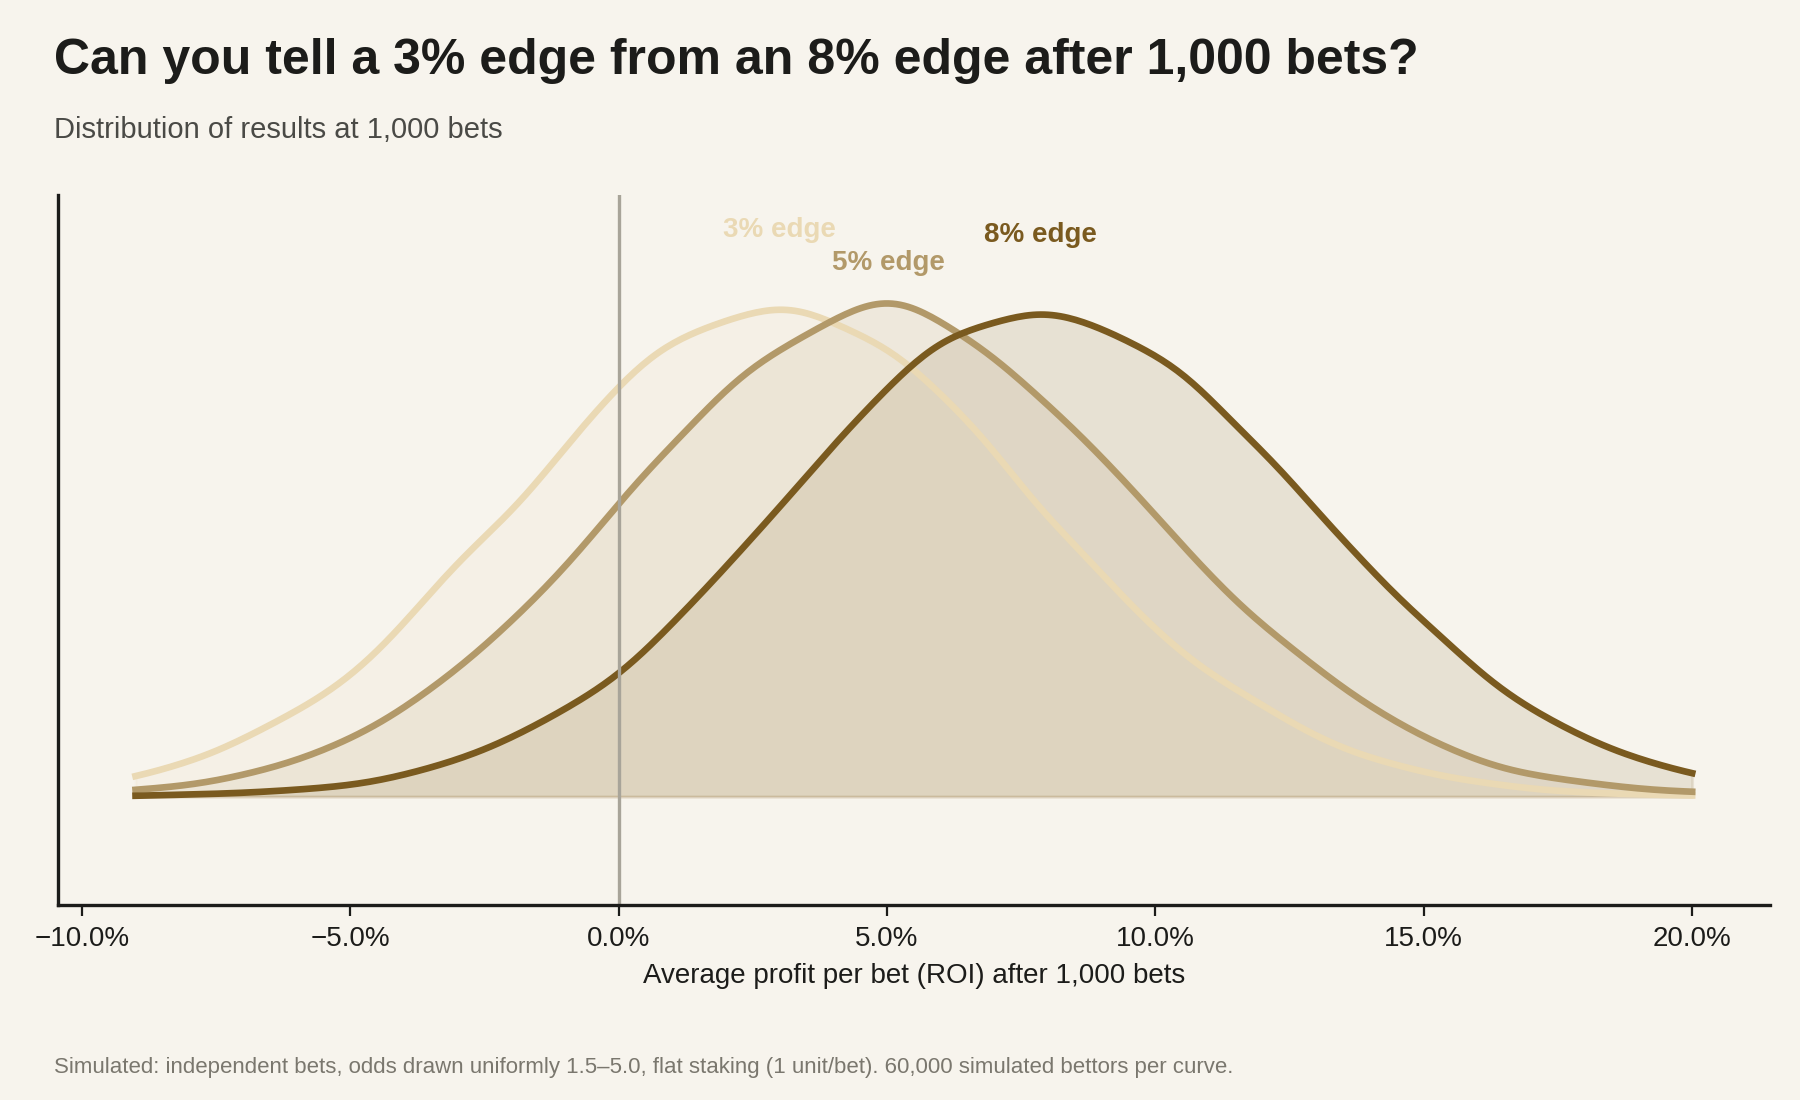
Here are three bettors with a 3%, a 5% and an 8% edge, each after a full thousand bets. The distributions overlap so heavily you couldn’t confidently tell which bettor was which from their results alone. Even a large edge hides in the noise for longer than intuition allows. Are there any more variables we can tug at to try and improve things? Is there an alternative method of suffering around which odds we bet at?
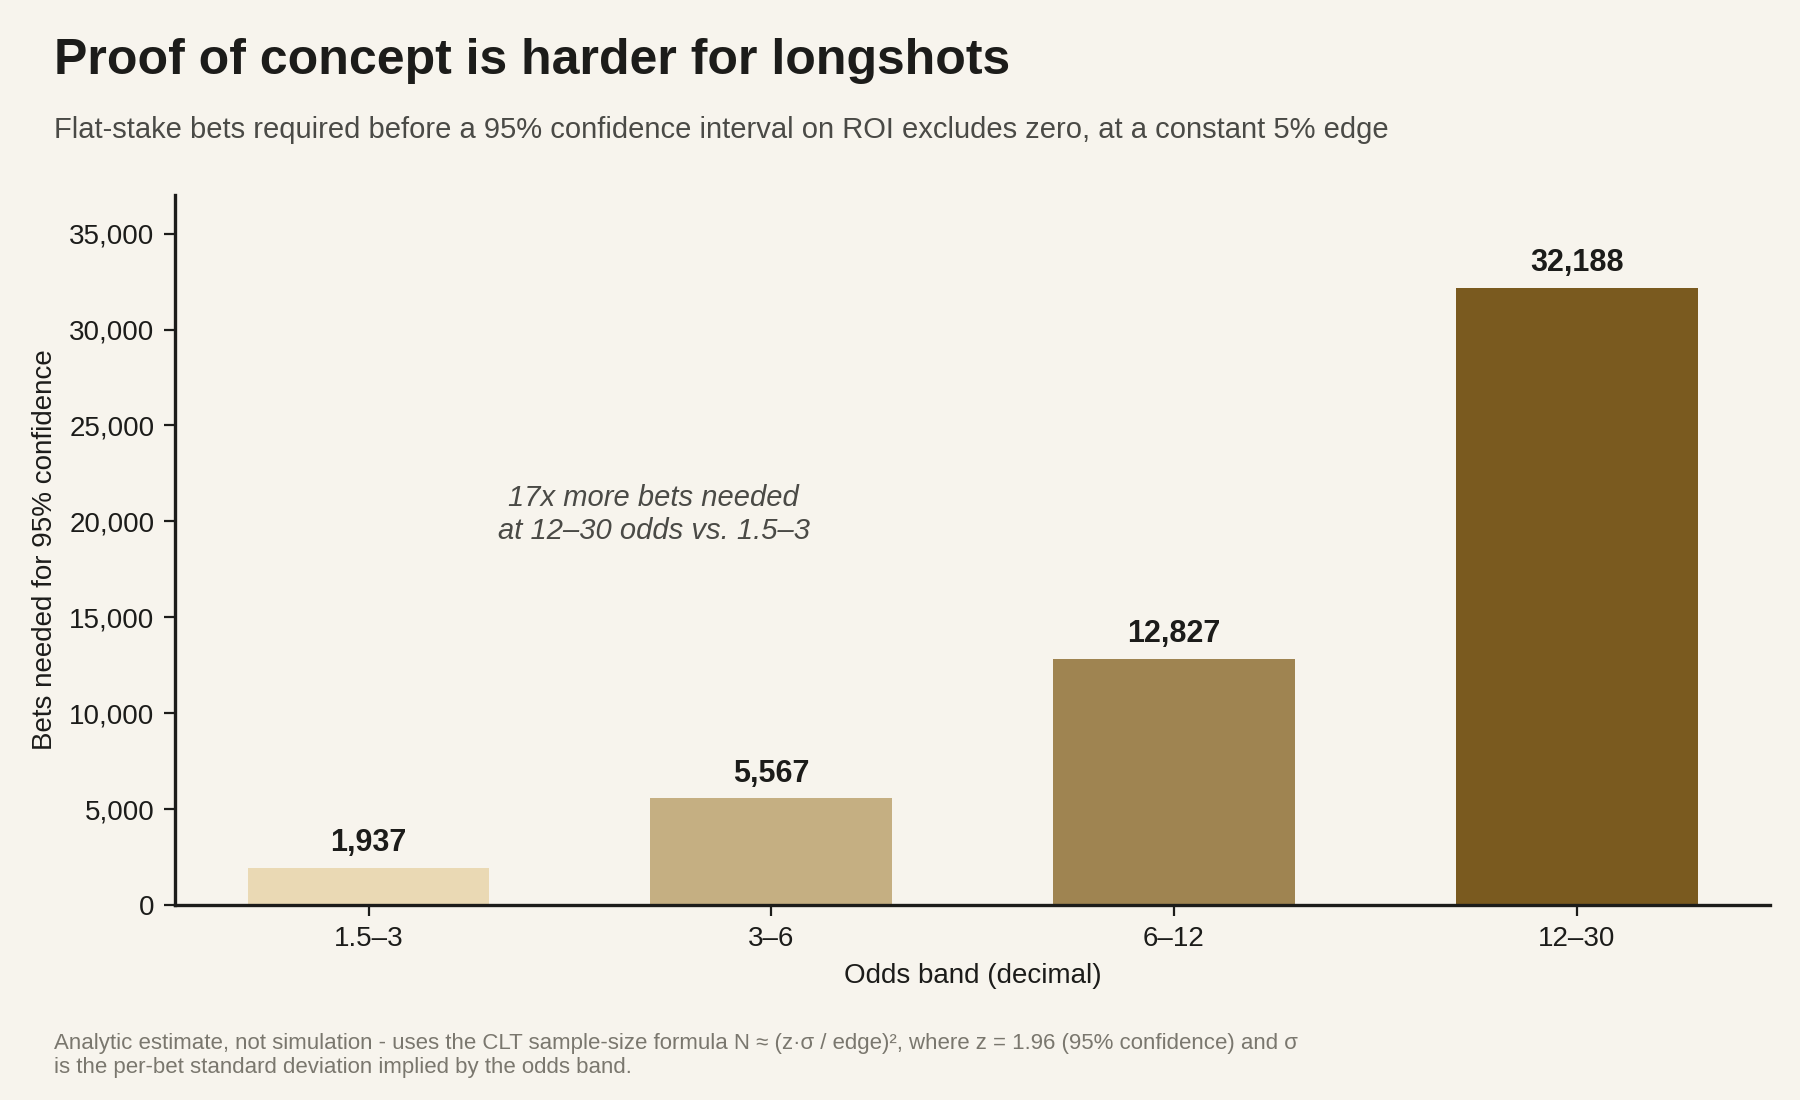
That's the number of bets required before a 5% edge becomes statistically distinguishable from no edge at all, broken down by odds bands. Down at short odds, it’ll take around 2,000 bets on average to get a statistically significant result versus circa 32,000 for our longshots. We can at least take some comfort in having a way to improve our ability to verify edges. If we can decrease the variance per bet, we should be able to verify whether we’ve found a winning strategy much sooner.
And what about staking? Staking is unfortunately a big enough issue to get its own post. Under certain staking regimes +EV strategies are guaranteed to go to zero, so it’s a vital piece of the puzzle which we can use to validate strategies more effectively.
But where does this leave us for now? Well, if we want to test our models against the main lines that attract big money, we can compare against the CLV and should get a fairly good feel for whether we have something worth running. If we want to go into the more niche corners of betting we’re probably going to have to take a statistical approach to confirm our edge post-hoc. Of course, we should have some level of conviction behind our strategy before running it. There should be a logical reason why our strategy is +EV, which we can verify after the fact, so we aren’t starting from zero.
In the next post we’ll cover staking with the Kelly criterion, including its impact on total profit and our ability to verify edges. We’ll then move onto our first true ‘Research Desk’ post, covering a simple exchange arbitrage strategy, which we’re now better equipped to enjoy the zero-variance nature of. See you then.
The Alternative Desk
Still a going concern